
Charting the Leak: Six Months in One Tide Table
Six months of statements showed a $327 monthly leak hiding in delivery fees, duplicate subscriptions, and convenience purchases—not one dramatic mistake. Mapping $28,416 from February 1 through July 31, 2026 into a tide table gave us a realistic $4,410 monthly baseline and three specific changes worth $1,962 a year.
We began with exports from one checking account and two credit cards, then reconciled transfers so the same dollar was not counted twice. The period ran from February 1 to July 31, 2026 and covered 913 posted transactions. Refunds reduced the category where the original purchase appeared. Credit-card payments and moves to savings were excluded from spending; goal contributions were tracked separately.
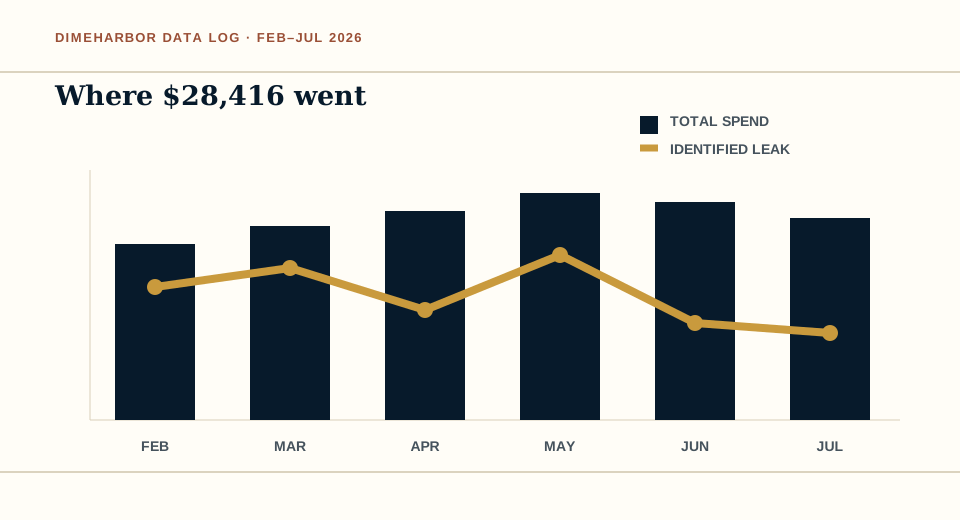
The answer was a current, not a catastrophe
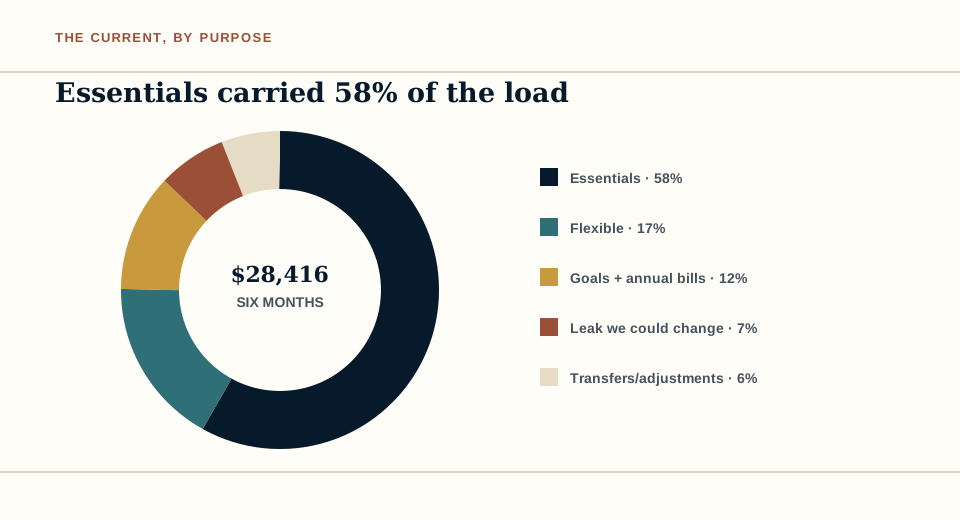
Total outflow was $28,416, or $4,736 per month. Essentials—housing, utilities, groceries, transportation, insurance, and minimum debt payments—absorbed $16,482. Flexible spending took $4,831. Annual bills and savings goals accounted for $3,411, while transfers, corrections, and reimbursed work expenses made up the remainder.
The useful number was $1,962 across six months that did not reflect our priorities. That was 6.9% of all outflow and $327 a month. Food-delivery markups and fees contributed $714; overlapping media and cloud subscriptions added $438; small convenience-store stops totaled $486; and three forgotten renewals supplied $324. None looked urgent alone. Together they equaled more than the household’s monthly electric, internet, and mobile bills combined.
| Category | Six-month total | Monthly average | Share | Decision |
|---|---|---|---|---|
| Essentials | $16,482 | $2,747 | 58.0% | Protect the realistic baseline |
| Flexible living | $4,831 | $805 | 17.0% | Keep; cap by week |
| Goals and annual bills | $3,411 | $569 | 12.0% | Automate after payday |
| Identified leak | $1,962 | $327 | 6.9% | Cut $164, keep $163 |
| Transfers and adjustments | $1,730 | $288 | 6.1% | Exclude from the budget baseline |
How we decided what counted as a leak
We did not label every restaurant meal or impulse purchase a leak. A transaction qualified only if one of us said, during review, that we would not buy it again under the same circumstances. That rule protected pleasure and exposed low-value repetition. Friday pizza stayed. A second streaming plan nobody had opened since March did not.
We also separated price from frequency. Groceries rose in May, but the receipts showed ordinary food plus two household staples bought in bulk. That was a lumpy essential, not overspending. Delivery was different: the food itself averaged $28, while taxes, markup, tip, and fees lifted the typical charge to $44. Replacing two deliveries a month with pickup saved an estimated $192 over six months without banning takeout.
The monthly average needed a weather allowance
A flat $4,736 budget would repeat the data without learning from it. We removed non-spending adjustments, cut only half the identified leak, and retained the higher of the six-month average or the recent three-month average for essentials. The resulting August 2026 operating plan was $4,410: $2,780 essentials, $790 flexible living, $560 goals and annual bills, $164 intentional convenience, and a $116 buffer.
That buffer is important. A plan built to the cent can be accurate and still brittle. July groceries were $91 above average; March fuel was $64 below it. The buffer lets ordinary variation move without turning every week into a correction meeting. Any amount left on August 31 will go to the starter emergency fund method, not silently enlarge the next month.
What the table changed
On August 2, 2026, we canceled two subscriptions, moved one annual renewal reminder 35 days earlier, and set a $95 weekly flexible-spending marker. We did not impose a no-spend month. The goal was to reduce drift while keeping the plan livable.
The first check is scheduled for September 1, 2026. We will compare categories, not demand identical totals. If the leak falls from $327 to roughly $163 and the overall plan lands within the $116 buffer, the map worked. Readers wanting an app for the same exercise can start with our tested 2026 rankings; readers who prefer manual categories can use the definitions in our plain-English money glossary.
Method note: DimeHarbor editors analyzed de-identified household exports. Figures are rounded to whole dollars; percentage totals may differ slightly because of rounding. This is a descriptive case, not a universal spending target.
Frequently asked questions
How many months of spending should I map?
Three months can reveal recurring patterns, but six months captures more irregular bills and seasonal changes. Start with the most recent complete month and work backward; do not postpone the exercise because you lack a full year.
Should transfers count as spending?
Usually no. A credit-card payment or move from checking to savings changes where money sits but does not create a second expense. Count the original purchase and label genuine bank fees separately.
What percentage of spending should be a leak?
There is no correct percentage. Our 6.9% mattered because the purchases did not match stated priorities. A smaller number can still be worth changing, while a larger flexible category may be entirely intentional.